

As 2026 begins, we’re answering one of last year’s most common questions. What makes a good video watch time?
Over the past few years, videos have become a top content priority across most platforms. Many apps now feature video as their primary content when you open them. We analyzed whether video watch duration impacts content performance across key metrics.
This analysis focuses on Meta’s two major platforms, Facebook and Instagram. Both have emerged as major drivers of reel-based content.
Before running each analysis across both platforms, we should outline the metrics used for this study. At the baseline level of social media analytics, you already recognize two core metrics across most platforms: engagement and reach. Engagement totals subcategories such as likes and shares, while reach allows us to see how many unique users watched the content. We will be utilizing these metrics to understand the relationship between video watch duration and content performance.
For analyzing watch time, we also need to consider metrics unique to videos, such as average watch duration and retention rate. Average watch duration measures the mean time (in seconds) viewers spend on a specific video or reel across all plays. The average retention rate then normalizes this by dividing the video's total length by the video’s total length and multiplying by 100, which yields a percentage of completion.
For this analysis, we will review all video content shared in 2025 across each platform at That Random Agency.
We took average watch duration and retention rate across all video content on each platform and modeled them against engagement and reach to test for linear relationships. For these outputs, we removed extreme outliers due to the wide performance variation of reel content across both platforms. What we call extreme outliers, most people will also call viral.
From our 40 organic videos this year, we produced the following table for Facebook, showing linear fits between average watch duration and retention rate on engagement or reach.
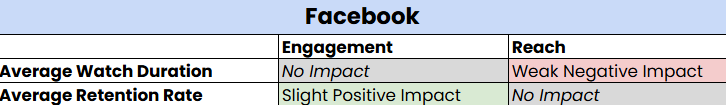
Based on the results of each model fit, a linear relationship existed between average watch duration and reach, as well as between average retention rate and engagement.
A summary:
Upon reviewing the test results for average watch duration in relation to reach, we decided to investigate further by separating them into five different watch time brackets.
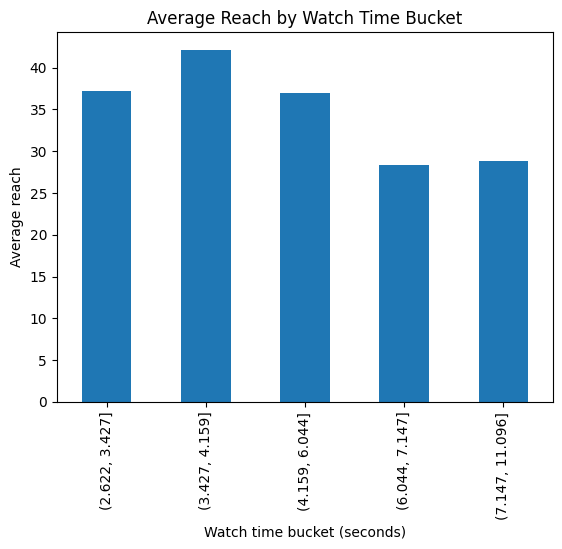
Supporting our conclusion of “Weak Negative Impact” from these metrics, higher video reach was achieved at shorter durations. This aligns with our findings across both Meta platforms throughout the year, given that shorter videos' boost to reach is driven by higher completion rates and algorithm preferences for quick, full watches.
We also tested our organic Instagram video content, using a larger sample of 101 videos for the year. One thing to note about Instagram’s native reporting is that it rounds average seconds viewed to the nearest whole second, making this metric less precise than Facebook’s. This is where our larger sample size can make a difference.
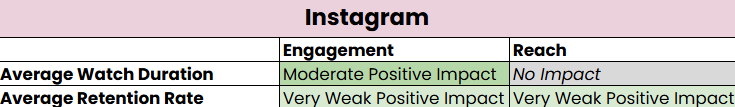
After running the same tests, we observed a more linear relationship between watch duration and retention rate in relation to content performance.
A summary:
Once again, we can separate and see how average engagement is impacted by different watch time buckets and produce the following chart:
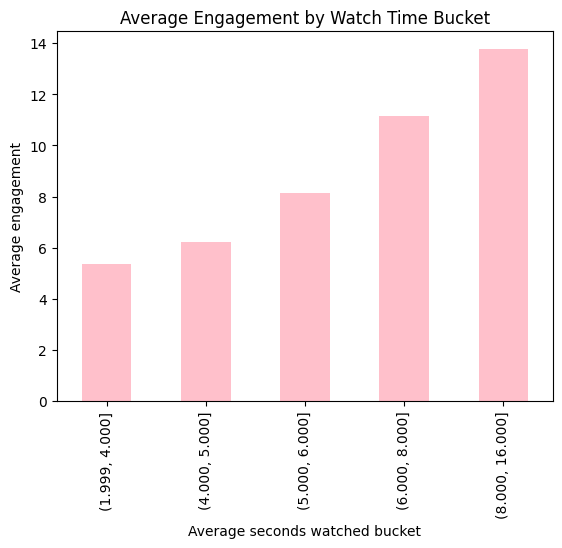
Considering that 16 seconds was our upper bound for the highest watch duration in a content pool primarily composed of shorter reels, it’s no surprise that our most engaging reels were those that kept users fully engaged. We also observed that retention rate on its own doesn’t strongly impact engagement, but when paired with average watch time, it has a more significant effect. In summary, for our Instagram account, higher-engagement video content appears to hit a sweet spot around 8-16 seconds of average user watch time in 30-second videos
Based on our test results, here are the key high-level takeaways:
In conclusion, as noted in all our tests, these results may vary based on factors such as industry, audience, scheduling habits, and others. What we conclude as statistically significant may not be the same for another account, even if it's another digital marketing agency. It's important to consider results based on your own social data and observations.
Need help optimizing your social media based on data? Chat with our team today!


