

We’re heading into crunch time for 2025, and thought it would be an excellent opportunity to identify key social media benchmarks for the financial industry.
Engagement rates remain a popular choice of KPI as they directly reflect how effectively financial brands are connecting with their audiences through content. We will look at these specific percentages for this industry across five of the more mainstream platforms: Facebook, Instagram, TikTok, X, and LinkedIn.
We will draw from Hootsuite’s report, which covers average engagement rates across various industries in a study conducted this year.
Engagement Rates (Per Post)
| Platform | Engagement Rate (Industry: Financial Services) |
| 1.8% | |
| 3.8% | |
| 3.2% | |
| X | 2.1% |
| TikTok | 1.6% |
As discussed in previous blogs, when comparing to benchmarks or studies, it is essential to ensure that our KPI (engagement rate) is calculated similarly to the metrics we are referencing. Since engagement rates can vary depending on the variables and platforms used, we will use the following formula from Hootsuite as the basis for these benchmarks:
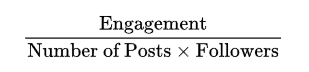
In the context of the Hootsuite report, engagement also includes the number of clicks and DMs, which may not always be conventionally included in other variations of this formula. Additionally, the number of posts is subjective to the chosen time period. For example, you may count posts from a given month or year. We recommend using monthly durations to better account for significant platform changes or updated studies. If the post volume for any given month is small, consider a duration that covers at least 30 posts.
Based on the overall report, financial services show strong engagement performance compared to other industries on:
Meanwhile, engagement is lower (<2%) on:
Financial institutions should:
Want personalized help with marketing strategies to optimize your social media results? Chat with our team today!


