

We’ve heard it before: What is the average engagement rate for our industry? What is the optimal follower growth per month? Is our content clickthrough rate high enough? What is a good salt ratio for per pound of french fries?
Okay, maybe not that last one, but a majority of these questions are simply addressed through social media benchmarking.
Social media benchmarking evaluates your current social media performance relative to industry standards, competitors, or even your own historical performance.
Most major social media platforms have a wealth of data available for you, which allows you to take a look at your content at more than surface level.
You may be wondering: why go through all the trouble of benchmarking your own social media data when industry averages are just a Google search—or even a ChatGPT prompt—away? The simple overarching answer lies in the fact that social media is a highly dynamic space, making it extremely rare to find a single optimal estimate for most metrics tailored to your specific profile.
Lets take a popular and frequently benchmarked metric for example: engagement rates. Engagement rates represent the overall percentage of engagements on your social media content in relation to your audience. Countless studies on this percentage for various industries are scattered across the internet, but many users may not realize that there is no single, uniform method for calculating engagement rates.
Here’s some of the ways we have seen this metric be formulated:
Oftentimes, studies won’t disclose the exact formula for the metrics in question. To use a statistical term, there is a significant risk of heterogeneous measurement—where metrics are not standardized across studies. If one study uses an engagement rate formula that differs from the one you use, it can lead to inconsistencies and improper benchmarking.
Beyond measurement inconsistencies, another limitation of generalized benchmarking is that industry averages are, after all, just that—averages. More often than not, they fail to account for other dependent variables, such as the follower count of analyzed profiles, the total number of accounts included, post volume, content distribution, and more. Combined with the potential opacity of the calculations themselves, this can create further comparative issues. Therefore, it is best to use industry benchmarks as an extremely high-level overview of your performance and focus on developing your own personalized benchmarks.
Today, we are going to take a dive into how you can benchmark your own data using some simple methods, all without needing to rely on third-party tools or breaking the bank.
We’ll use Meta Business Suite as our example.
Meta Business Suite is a free platform that allows businesses to manage their Facebook and Instagram profiles. It provides extensive access to your channel's analytics, which can be used for benchmarking. You will need a Facebook page in order to access this.
Let’s continue with the topic of engagement rates in our example and create personalized benchmarks. We’ll need data on our content to follow this process.
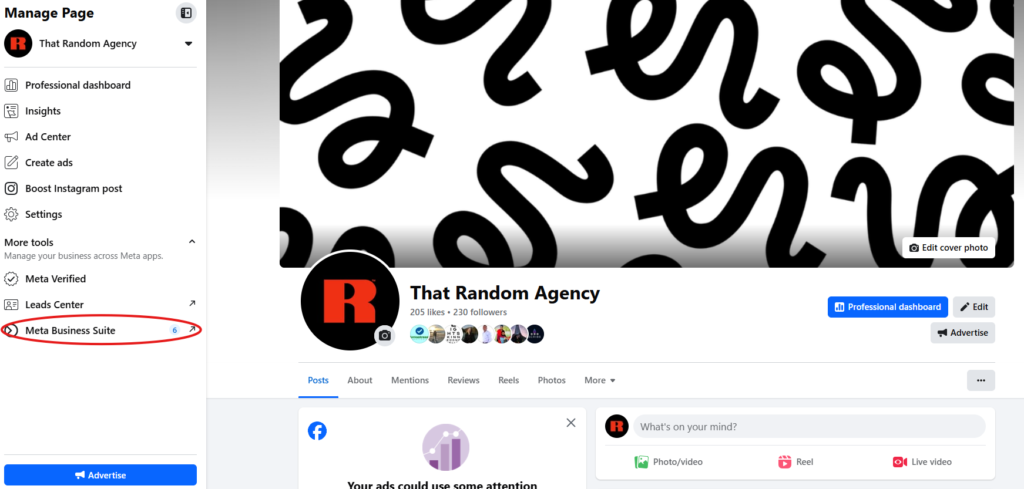
1.) Locate ‘Meta Business Suite’ on the left panel once you are accessing your page.
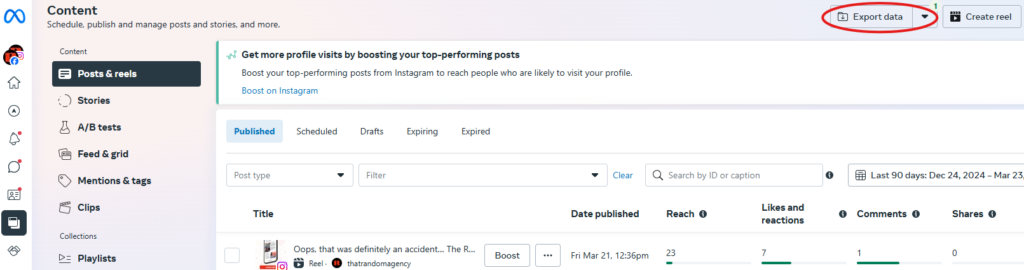
2.) In another left panel once in Meta Business Suite, look for the ‘Content’ option.

3.) Once in the Content page, you should see an option towards the top right to export performance data on your page’s Meta posts. Use this to export data on either Facebook or Instagram content through a set date range.
From this point, you need to do some spreadsheet work to formulate some content benchmarks for our channel. There are potentially hundreds and thousands of ways you can explore this dataset for benchmarking purposes.
For engagement rates, Random typically uses reach for Facebook or Instagram. This is Meta’s native denominator for calculating the metric (feel free to use impressions if preferred). This also gives us a better understanding of how our content is resonating with engaged users, both followers and non-followers, compared to dividing by followers.
Furthermore, we utilize rolling benchmarks with a maximum of three to six months of content data, as social media platforms tend to be fluid with algorithm changes and major updates. While there's no real downside to setting your duration longer than this, we find relatively shorter durations to be pretty representative as long as posting frequency is adequate. Note: Meta Business Suite won’t let you export beyond 92 days of duration. This means you may have to aggregate multiple datasets if wanting longer durations.
Continuing with our example, let’s say you want to calculate your up-to-date content average for engagement rate. In the 'Export Data' option, you can select the platform, set the dates (we’ll use the full 92 days up until the current day), and then export the data.
Here are a few calculation examples:
What you have now is your channel’s up-to-date average engagement rate for the past three months of content. You can compare this to the next three months of content, the same three-month period from the previous or next year, or update the value with newer months. The method for benchmarking this average is entirely flexible.
Calculating the median is an excellent way to benchmark your content engagement rate. Medians are naturally more resistant to outliers, which are common in social media analytics—such as viral videos, content types, etc. Although the exact formula for engagement rates is often difficult to discern in any particular study, most will utilize either averages or medians. We recommend comparing the median engagement rate to your individual content as this is likely a better representation of typical performance.
As we have shown, there are numerous ways to approach benchmarking. These include followers, clicks, click-through rates, video metrics, and more.
However, there are many considerable benefits to benchmarking your own performance:
Want personalized help with benchmarking strategies to optimize your social media results? Chat with our team today!


