

It’s no secret that TikTok has been at the center of a political storm in 2025, facing waves of government bans and mounting pressure like never before. Regardless, we are here to help weather the storm and provide you with some benchmarks for the new year.
Once again, Rival IQ released its yearly iteration of key social media benchmarks for 2025, including TikTok. In this post, we will:
Benchmarking is a key part of the analytics process, allowing you to compare your social media results against specific thresholds or standards. This allows you to set realistic objectives, optimize strategy, and identify what's best for your business.
The Rival IQ report focuses on metrics relative to industry benchmarks. However, you can also create your own benchmarks for a more tailored understanding of your marketing performance. Learn more from our experts about personalized benchmarking!
Much like last year’s benchmarks, we have a new set of engagement rates across various industries for TikTok.
Alcohol: 1.76%
Fashion: 0.95%
Financial Services: 1.33%
Food & Beverage: 2.04%
Health & Beauty: 0.85%
Higher Ed: 7.36%
Home Decor: 1.52%
Influencers: 1.11%
Media: 1.34%
Nonprofits: 3.04%
Retail: 1.28%
Sports Teams: 2.68%
Tech & Software: 1.21%
Travel: 2.73%
The overall median across all industries is marked at 1.73% for 2025.
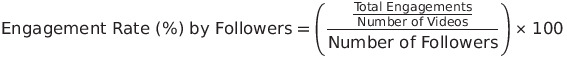
As another refresher, these figures represent the engagement rate per video relative to followers. You can calculate this for your account by summing all engagements (likes, comments, shares, etc.), dividing that by the total number of videos, then dividing the result by your total number of followers, and finally multiplying by 100 to express it as a percentage. You can use the following expression to get the engagement rate by followers for any platform:
According to Rival IQ’s report, TikTok’s overall engagement rate has declined compared to the previous year. When considering this form of engagement rate, which accounts for both posting cadence and follower count, these changes can be directly influenced by shifts in either volume. It's much more challenging to maintain high engagement rates with an increase in cadence or a significantly larger audience pool. General platform turbulence may have also played a role, especially with all the shutdown news during this reporting year.
As an additional reminder, engagement rate medians and averages can be somewhat volatile in comparison contexts due to factors mentioned above—such as differences in posting activity and audience size across accounts. It’s best to approach industry comparisons from a broader, high-level perspective and consider additional benchmarking that incorporates your own data.
Want personalized help with benchmarking strategies to optimize your social media results? Chat with our team today!


