
We’re kicking off our first quarterly Random Labs experiment of 2025! Before diving in, you might be wondering, “What is Random Labs?” The answer is simple: Random Labs is a quarterly blog series where our team of marketers and data scientists put a theory to the test to either myth-bust or prove a marketing-related hypothesis. For Q1, 2025, here’s what we tested: What’s the performance impact of blogs on websites?
You’ve probably heard it a million times: “Blogs are essential to boost SEO and your website performance!” But what impact do they actually have? We tested this hypothesis through a more extensive lens and implemented robust data analysis.
For this experiment, we gathered blog data from early 2024 to early March 2025, tracking the total number of blogs and selecting dependent variables related to website performance. Dependent variables are the factors we are measuring to assess how blog presence influences website performance.
New users and sessions are both crucial metrics for analyzing overall website traffic. The gap between sessions and new users can provide insight into how often users return to the site. Additionally, bounce rate helps assess user engagement, though its significance depends on the context. In many cases, a lower bounce rate is preferable.
In this analysis, we will break down higher-level variables, such as total blog quantity, and then drill down into specific blog categories and topics to assess their impact on website performance.
We begin with a high-level correlation check between the total number of blogs and the dependent variables. While we do not expect a strictly linear relationship between blog quantity and traffic—given the influence of other marketing tactics such as organic media, paid media, and referrals—blog content can still indirectly support these channels over time. This check provides a broad understanding of overarching trends before we narrow our focus to more precise insights in the next steps.
We construct the following scatterplots:
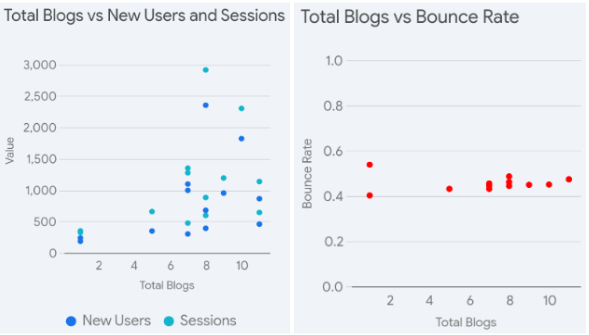
Scatterplots are excellent visualizations for analyzing relationships between independent and dependent variables. Our output shows an increasing trend in new users and sessions as the total number of monthly blogs increases, with greater dispersion in values.
The variance in bounce rates appears to decrease when the monthly blog cadence reaches approximately 8–10 blogs per month.
We can further supplement our scatterplots by constructing a correlation matrix, which provides more of a numerical perspective of the relationships between these variables.
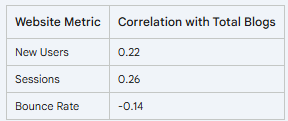
Reading a correlation matrix is quite simple in this example. The numbers listed in the table represent what is known as a correlation coefficient. This is a number between -1 and 1 that measures the strength and direction of the linear relationship between two variables. In practice, it is rare to see a value of exactly -1 or 1, as these represent perfect negative or positive correlations, which are uncommon in real-world data. The closer these coefficients are to those endpoints, the stronger the linear relationship we can conclude between those variables.
The outcome suggests a weak positive correlation between the total number of monthly blogs and the resulting new users and sessions.
Additionally, a weaker negative correlation exists between the total number of monthly blogs and website bounce rates.
This aligns with what we see in practice, as blog content is only one of many channels that drive traffic to a website—others include organic and paid social, referrals, links, search, and more. While we see some mild signs of increased website traffic alongside a potential decrease in bounce rates, more content may not always be the answer, as our upcoming findings will suggest.
Due to the nature and purpose of blogs, which cover a wide range of topics, our next analysis can focus on specific blog topics. The following categories were used on the same dataset to organize the large number of blog posts:
Considering the significant amount of topics we are utilizing compared to our previous step, we can use a different visualization to analyze the performance between these blog topics in relation to website performance. A correlation heatmap can be a great visual tool for this example:
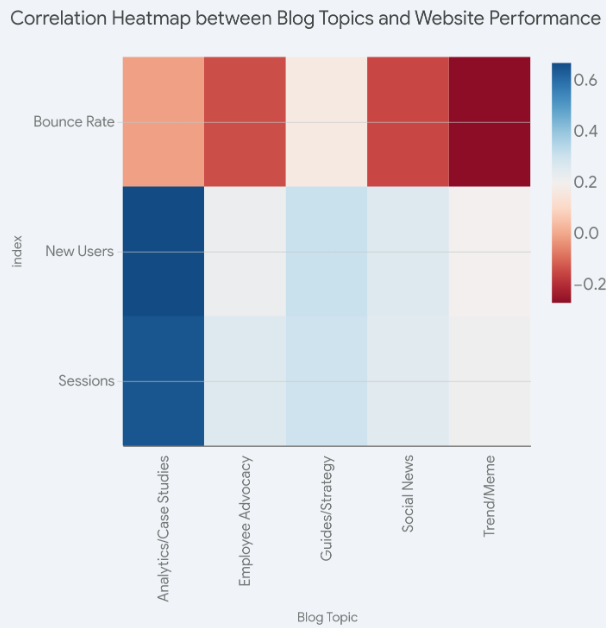
The interpretation of this chart is similar to that of the correlation matrix, with the key difference being the use of color shading instead of coefficients, along with an expanded set of independent variables in the blog topics. In our example, a darker shade of blue or red indicates that a variable's correlation coefficient is closer to -1 or 1. Conversely, a lighter shade signifies a weaker linear relationship between those variables. The bounce rate is represented by a separate color scheme, reflecting its decline as blog activity and other optimizations increased over the months.
Much like our previous step, we can also supplement with a correlation matrix:
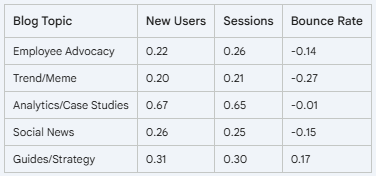
Based on the output of both charts, we can create some conclusions based on specific blog topics relative to the website performance metrics:
Blog content related to Analytics or Case Studies showed a relatively strong positive linear relationship with an increase in new website users and sessions.
Summary: Blogs on this topic include social media benchmarking, various tests, and case studies on well-known, high-interest questions, which could explain the relatively higher search intent. Additionally, we have observed a growing share of traffic coming from AI over the year (with ChatGPT being a prime example), and this channel has been notably more consistent for blogs related to benchmarks. The general query for AI users for finding benchmarks may be higher in volume than other topics, which may have more varying topics.
Blog content related to Trends or Memes showed a slight negative linear relationship with website bounce rates. However, this relationship was the strongest among all topics.
Summary: Trends and memes are often highly engaging visually and in terms of topic, which may influence readers to stay on the page. Additionally, blogs discussing trends or memes usually link to related posts, videos, or explanations, naturally encouraging visitors to click through rather than bounce. Current events and cultural moments may also attract users with a naturally higher level of interest.
As an additional point, the results here do not suggest a lack of relevance for the other blog topics. As mentioned before, numerous influences affect the website side of things. For example, although employee advocacy blogs don’t stand out in terms of the most substantial linear relationship with website traffic, they are often our highest-performing content on social media.
Additionally, blogs on Guides and Strategies represent our densest volume in total blog posts and likely cover the most variance of topics. This explains why it may contribute to higher bounce rates overall. A fully layered evaluation is critical for analyzing the overall effectiveness of your blog posts.
We can further narrow our focus on blog content by evaluating the specific blogs that stood out regarding website performance. Here are some of the top Random content for the year!
The blog directly addresses a topic of massive interest: pop culture. This naturally attracts a large audience, as people are drawn to discussions about movies, music, events, and trends. Additionally, pages with embedded videos have the potential to rank for more keywords and achieve higher average positions on Google’s SERPs. Overall, this blog ranked highest for us in terms of both the total volume of new users and sessions, which is quite impressive considering its recent publication.
As we’ve observed in our previous steps for analyzing blog topics, “benchmarking” is likely a strong keyword for SEO, especially in the marketing and social media niches. While “benchmarking” itself is broad, long-tail variants (e.g., “Here Are the Latest TikTok Benchmarks for 2024”) attract more targeted traffic with less competition. Upon consistently evaluating blogs related to these topics, we’ve also noticed their high evergreen impact, as they remain among our highest-performing blogs by traffic even in 2025. Lastly, as previously mentioned, the implications of search traffic coming from AI have significantly benefited these blogs and will likely continue to enhance their performance.
Although the August 2024 iteration stood out for its overall performance in hindsight, we consistently find great success with these memes and trend recaps each month. The blog’s blend of timeliness, shareability, and utility makes it a traffic magnet. Memes will likely experience short-term traffic surges but at significantly high magnitudes, driven by the trends themselves. The August iteration's standout performance is a good example of this, as it aligned with highly popular events like “demure,” the Paris Olympics, and the summer season in general.
This blog led the way in the Guide or Strategy category of Random blog content. As with some of our other high-performing blogs, timeliness was a key factor, as this post was published in anticipation of National Small Business Week (April 28 - May 4). Other high-performing aspects included elements common in successful blogs, such as the numbered listicle format, content that resonates well with our specific audience, and seasonality.
To conclude our first quarterly Random Labs experiment of 2025, blog content can be an effective tactic for potentially elevating overall website performance.
While the overall cadence of blogs may not strongly correlate with an increase in total website traffic or changes in bounce rates, factors such as timeliness, shareability, and relevance can significantly impact performance on an individual case-by-case basis.
As we have frequently observed with their evergreen success, tailoring and evaluating blogs across all facets—such as social media engagement, audience relevance, and content quality—are essential for long-term success. Focusing solely on increasing website traffic can overlook the importance of creating meaningful, shareable content that resonates with readers and enhances overall brand presence.
Looking to elevate your digital marketing and SEO game? Chat with our team today!


