
2026 is well underway, and we thought it would be a great opportunity to share the social media benchmarks for retail brands. We will be utilizing Hootsuite’s industry-based analysis across primary KPIs for social media performance using year-wide data in 2025.
For a deeper dive on deriving some of these core metrics, such as engagement rates, check out our previous blog!
We will evaluate some of the core social media platforms such as Facebook, Instagram, LinkedIn, and TikTok.
The following table summarizes different performance metrics for retail brands, calculated by Hootsuite’s latest readings.
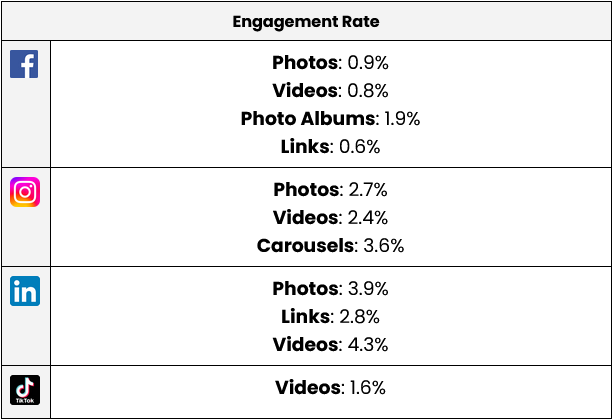
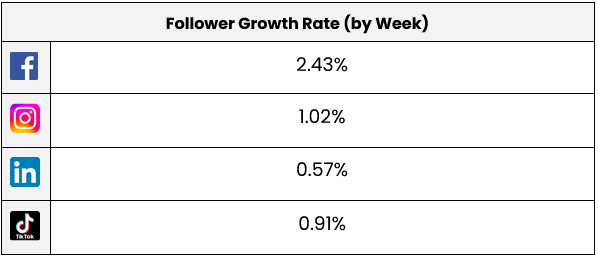
Based on the tables, we can summarize the following key takeaways:
The question almost answers itself. Videos typically generate significantly higher viewership and reach across most platforms because they are prioritized by algorithms. This often results in a disproportionate gap between how many users engage with the content and how many consume it, directly lowering the engagement rate.
Not necessarily. While the follower growth rate may look enticing, we must consider Facebook’s heavy reliance on paid reach. There may also be a negative correlation between its higher growth rate and its comparatively lower engagement rate when compared to our other channels because of those reasons.
As we emphasize in all our benchmarking studies, it is best to use this data as a general baseline. Nothing is more appropriate than analyzing your own social media data and optimizing based on the needs of your individual business channel.
Need help optimizing your social media based on data? Chat with our team today!


